WSCC Care and Support At Home Customers By Area
WSCC Care and Support At Home Customers By Area
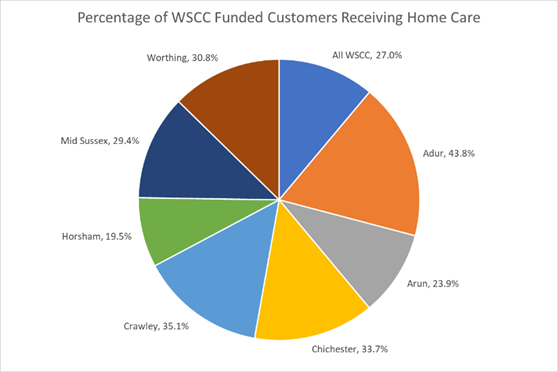
The information in the image of the chart below shows the percentage of WSCC funded customers who are receiving care and support at home. Interestingly Adur has the highest proportion of funded customers receiving care and support at home as opposed to other services. The differences in some areas may be as a result of supply in other parts of the market. For example the older people’s bed based care market position statement confirms that there are 16 residential and nursing care homes in Adur compared with 56 in Arun. This may be a reason why more people are proportionately receiving care and support at home in Adur, although this will require further exploration to understand fully any causal links.
Current Number of WSCC Funded Care and Support At Home Customers
The table below gives more detail on the percentage of WSCC funded care and support at home customers by area by different ages and types of need. This shows nearly half of customers with a learning disability and customers of working age with mental health needs are receiving care and support at home in Arun and Chichester, whereas older people are spread more evenly, with the highest number being supported in Arun and the lowest number in Adur – which would correspond broadly with the population profiles of the areas.
|
Percentage |
All |
Older People with physical/ sensory impairment PSI |
Older people with mental health needs |
people with a learning disability |
people of working age with a physical/ sensory impairment |
people of working age with mental health needs |
Older people with a lifelong physical/ sensory impairment |
People of working age with a physical/ sensory impairment |
|
West Sussex |
100% |
69% |
11.3% |
1.5% |
12.6% |
2.9% |
0.3% |
2.3% |
|
Adur |
10% |
10.3% |
13.7% |
2.8% |
7.6% |
1.4% |
14.3% |
10.9% |
|
Arun |
21.6% |
21.1% |
25.8% |
25% |
18.9% |
28.6% |
0% |
20% |
|
Chichester |
14.4% |
14.6% |
12.2% |
22.2% |
13.3% |
18.6% |
28.6% |
12.7% |
|
Crawley |
12.9% |
13.3% |
8.5% |
13.9% |
16.2% |
8.6% |
14.3% |
7.3% |
|
Horsham |
12.1% |
12.2% |
13.3% |
11.1% |
12.9% |
7.1% |
0% |
7.3% |
|
Mid Sussex |
13.3% |
13% |
13.3% |
16.7% |
14.9% |
10% |
14.3% |
16.4% |
|
Worthing |
15.2% |
14.9% |
12.6% |
8.3% |
15.9% |
25.7% |
28.6% |
23.6% |
|
Unknown / out of county |
0.6% |
0.6% |
0.7% |
0% |
0.3% |
0% |
0% |
1.8% |